Use the {dehex} app to generate a random hex code and learn how to interpret it by eye.
tl;dr
The {dehex} package now contains a Shiny app that you can use to walk through the process of reading a colour hex code, as per David DeSandro’s method.
{dehex}cellent
In the last post I introduced the R package {dehex}. Its purpose is to help me (you?) look at a colour hex code and be able to ‘read’ roughly what colour it is without resorting to a lookup.

I promise this is a hex sticker, but it’s background is white, whoops.
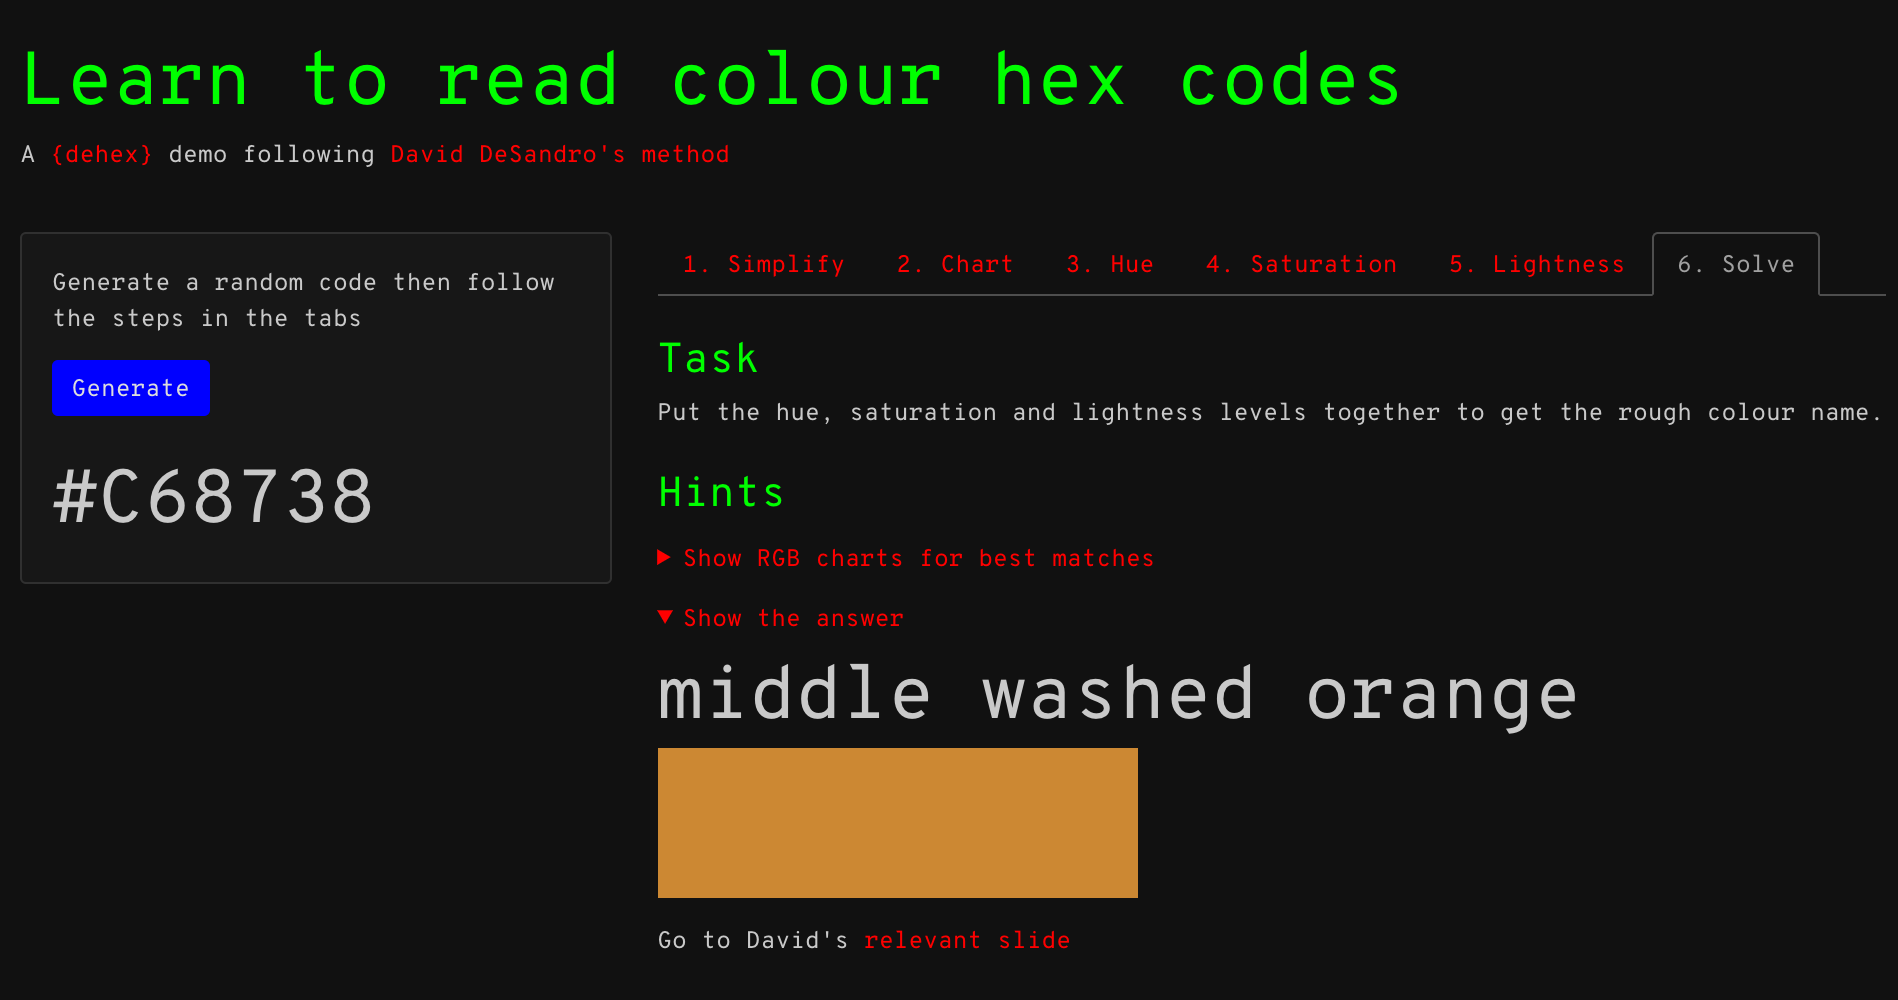
So, the computer-friendly code ‘#C68738’ can be interpreted by your brain as the human-friendly phrase ‘middle washed orange’.
The package only exists because of a mind-melting talk by David DeSandro and his recommendation of the approach due to his colourblindness. I’m also colourblind and would prefer to ‘solve’ a colour than try and guess what it is from a sample.
An apportunity
The {dehex} package uses a number of functions to help you through the steps of DeSandro’s method. It prints things to the R console to help you.1
There’s dh_shorten() to simplify the code to three digits; dh_graph() to make an RGB chart of your shortened hex code; dh_guide() to preview hue, saturation and lightness profiles to match against your shortened hex code; and dh_solve() to provide you with ‘the answer’, along with RGB charts for the nearest hue, saturation and lightness (HSL) profiles.

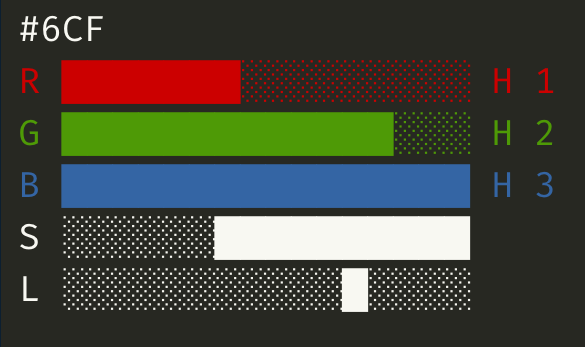
An RGB bar chart printed by {dehex} to the console, with guides for hue, saturation and lightness.
The trouble is that you have to know what order to run these functions. The documentation, README and blog post provide this information, as well as DeSandro’s resources, but it would be ideal to have an option to showcase {dehex} and learn stuff without needing to type any functions yourself.
So, I’ve created a simple Shiny app and made it available as the dh_app() function in {dehex}.2 I consider it ‘in development’ (this absolves me of liability if I say this, yes?).
The app depends on two packages: {shiny} and {bslib}. You’ll have to install these separately to {dehex} by using install.packages(c("shiny", "bslib")) (if you haven’t already installed them on your machine).
These aren’t dependencies3 because you shouldn’t be forced to install them if you have no plans on using the app.4
Aside: what’s fun is I get to make further use of the Shiny app README badge I invented (?) with my {badgr} package, like so:
lolwat?
The app is pretty simple.
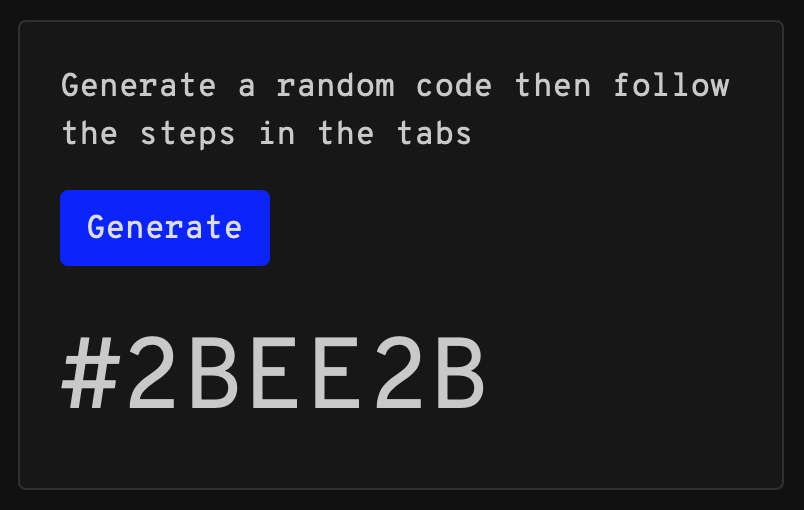
There’s a big blue button labelled ‘Generate’. Click it and a random six-digit colour hex code is generated.

‘That is the question.’
Your then proceed through the numbered tabs to learn about each step, get some quick bullets of explanation, and then have the option to reveal help via some outputs from functions in the {dehex} package. There’s also a link to the relevant slide of David DeSandro’s talk.
As a beginner, you’ll want to reveal the tips to get maximum help. As you get better, you may not need to reveal them anymore.
The final tab provides the solution. You should have the answer by the time you get to this tab, but it reveals to you the hue, saturation and lightness RGB profiles that best match the generated hex code, along with the answer as a string, and a sample of the colour itself.
The app is purposefully low on interactivity. It’s just a little sidequest that bundles the steps and relevant {dehex} functions, in case you don’t want to run the functions from R itself.5
Originally I was going to just create an app to go on the web for anyone to use, but why would they want to see outputs from {dehex}? I also think that it’s worth reading DeSandro’s blog and watching or reading his talk in the first instance.
As ever, make suggestions, issues, pull requests in the GitHub repo for the package. Or complain at me on Twitter.
Session info
## ─ Session info ───────────────────────────────────────────────────────────────
##  setting  value
##  version  R version 4.1.0 (2021-05-18)
##  os       macOS Big Sur 10.16
##  system   x86_64, darwin17.0
##  ui       X11
##  language (EN)
##  collate  en_GB.UTF-8
##  ctype    en_GB.UTF-8
##  tz       Europe/London
##  date     2021-08-27
##
## ─ Packages ───────────────────────────────────────────────────────────────────
##  package     * version date       lib source
##  blogdown      1.4     2021-07-23 [1] CRAN (R 4.1.0)
##  bookdown      0.23    2021-08-13 [1] CRAN (R 4.1.0)
##  bslib         0.2.5.1 2021-05-18 [1] CRAN (R 4.1.0)
##  cli           3.0.1   2021-07-17 [1] CRAN (R 4.1.0)
##  digest        0.6.27  2020-10-24 [1] CRAN (R 4.1.0)
##  evaluate      0.14    2019-05-28 [1] CRAN (R 4.1.0)
##  htmltools     0.5.1.1 2021-01-22 [1] CRAN (R 4.1.0)
##  jquerylib     0.1.4   2021-04-26 [1] CRAN (R 4.1.0)
##  jsonlite      1.7.2   2020-12-09 [1] CRAN (R 4.1.0)
##  knitr         1.33    2021-04-24 [1] CRAN (R 4.1.0)
##  magrittr      2.0.1   2020-11-17 [1] CRAN (R 4.1.0)
##  R6            2.5.1   2021-08-19 [1] CRAN (R 4.1.0)
##  rlang         0.4.11  2021-04-30 [1] CRAN (R 4.1.0)
##  rmarkdown     2.10    2021-08-06 [1] CRAN (R 4.1.0)
##  rstudioapi    0.13    2020-11-12 [1] CRAN (R 4.1.0)
##  sass          0.4.0   2021-05-12 [1] CRAN (R 4.1.0)
##  sessioninfo   1.1.1   2018-11-05 [1] CRAN (R 4.1.0)
##  stringi       1.7.3   2021-07-16 [1] CRAN (R 4.1.0)
##  stringr       1.4.0   2019-02-10 [1] CRAN (R 4.1.0)
##  withr         2.4.2   2021-04-18 [1] CRAN (R 4.1.0)
##  xfun          0.25    2021-08-06 [1] CRAN (R 4.1.0)
##  yaml          2.2.1   2020-02-01 [1] CRAN (R 4.1.0)
##
## [1] /Library/Frameworks/R.framework/Versions/4.1/Resources/library
Yes, but the quality of printing Unicode blocks in the app depends on what browser you’re using to view it. On macOS, Firefox seems fine. Other browsers don’t line up the little Unicode blocks nicely when outputting from
dh_graph(). Ah well.↩︎You can read about how to do this in Hadley Wickham’s ‘Mastering Shiny’ book.↩︎
In other words, they’re listed as
Importsrather thanSuggestsin the DESCRIPTION file.↩︎Using {bslib} is a bit lazy on my part because it makes it really easy to customise the style of a Shiny app, while forcing the user to have to install yet another package. This is not the tinyverse way, so I may refactor one day.↩︎
The ‘thought-of-a-thing-and-then-did-it-sort-of’ approach is very befitting of this blog and very apt given this is post number 100. 🎈↩︎
